
Deploying and aggregating distributed energy resources (DERs) on the distribution system is one of the fastest ways to interconnect new wholesale capacity. In the last 6 months Base has energized an aggregate volume of residential batteries equivalent to a 200 MW grid-scale battery that would have otherwise taken closer to 3 years to bring online. To fully recognize this untapped source of capacity, ERCOT has recently proposed an additional phase of its Aggregated Distributed Energy Resource (ADER) program. The proposed Phase IV extension would test and evaluate the formation of nodally aggregated DERs at select transmission points of interconnection, bringing to bear a powerful new framework for rapidly deployable sources of targeted, dispatchable capacity.
With load projections and interconnection pipelines surging throughout domestic RTOs and ISOs, the demand for net new capacity has reached its highest point in over two decades. This year ERCOT set an annual system load record of 91 GW, up nearly 6 GW from the previous. Meanwhile, PJM’s capacity auctions are repeatedly clearing insufficient supply volumes. Capacity is needed. Aggregated DERs present a unique opportunity to rapidly shore up capacity shortfalls while simultaneously providing direct benefits to rate payers with outage protection and potential for energy cost savings.
Total historical and EIA-projected US electricity consumption
All sectors, terawatt-hours per year. Projections cover every case published in the EIA Annual Energy Outlook 2026.
- Electricity consumption, all sectors
- AEO2026 Counterfactual Baseline case
- Range across all 11 AEO2026 cases
History: U.S. Energy Information Administration, Monthly Energy Review, Table 7.6 “Electricity End Use”, series ELTCPUS. Projections: U.S. Energy Information Administration, Annual Energy Outlook 2026 (released 8 April 2026), total electricity consumption, all sectors, for all published cases. Each case is scaled to meet the history at 2025, which removes a 2.5% level offset between the two accountings and leaves every growth path unchanged.
View the data as a table
| AEO2026 case | 2036 (TWh) | Growth from 2025 |
|---|---|---|
| Alt Electricity | 4,930 | 1.5%/yr |
| Alt Transportation | 4,612 | 0.9%/yr |
| Combination | 4,628 | 0.9%/yr |
| Counterfactual Baseline | 4,912 | 1.4%/yr |
| High Economic Growth | 5,054 | 1.7%/yr |
| High Electricity Demand | 5,012 | 1.6%/yr |
| High Oil and Gas Supply | 4,961 | 1.5%/yr |
| High ZTC | 4,905 | 1.4%/yr |
| Low Economic Growth | 4,747 | 1.1%/yr |
| Low Oil and Gas Supply | 4,762 | 1.2%/yr |
| Low ZTC | 4,922 | 1.5%/yr |
If new capacity is not installed to address the exponential energy demands of data centers, all ratepayers will face rising energy and delivery costs. Data centers are willing to pay far more for energy than virtually any other energy consumer, as evidenced in a recent study by F. Billimoria and C. Byers. If a data center is forced to curtail to ensure supply and demand are balanced, the price at which they are willing to curtail is extremely high. To ensure power balance in a future with many GW of new data centers, generating and delivering more energy at $40/MWh is more economic than using less energy at the cost of $40,000/MWh.
| Compute class | On-demand | On-demand with SLA | Interruptible |
|---|---|---|---|
| Legacy / Older Vintage | $2,200–4,800 | $18,600–39,800 | $700–1,800 |
| Transitional / Early AI | $7,200–10,900 | $60,000–90,900 | $1,300–3,200 |
| Mainstream Modern AI | $6,100–13,000 | $50,500–108,300 | $2,100–6,000 |
| Emerging / Frontier AI | $10,900–14,800 | $90,300–122,500 | $2,800–3,400 |
We need net new capacity, and we need it fast. But we require more than just putting more watts on the system; we need targeted, dispatchable capacity, and deploying and aggregating DERs is the way.
Why aggregate DERs?
If aggregate DERs are an answer to acute bulk capacity needs, the questions on any system operator’s mind are:
- Volume: Can these systems be installed and aggregated into meaningful gigawatt volumes?
- Dispatchability: Can an aggregation be dispatched to actively maintain power balance, with comparable accuracy to other utility-scale resources?
- Transmission value: Can these aggregations be installed where it matters?
Base Power Company’s participation in ERCOT’s ADER program is a bellwether answer to all of these questions. Base is the resource developer, retains ownership over the DERs being deployed, and in exchange for hosting a Base system, members benefit from cheaper energy rates and home backup functionality without paying for entire home battery systems upfront. Base then utilizes the ADER program to roll up hundreds of megawatts of batteries being installed month-over-month to provide real-time visibility and dispatchability to ERCOT.
What is the ADER program?
ERCOT’s ADER program is an implementation of FERC Order 2222 in spirit, if not in name. The ADER program provides a pathway for small, easily deployed devices like home batteries to be aggregated into transmission-scale volumes and rendered directly dispatchable by a balancing authority through a wholesale market mechanism, as was the intention of Order 2222. For many RTOs and ISOs, Order 2222 aimed to unlock this capacity but implementation has been slow. Achieving credibly dispatchable volumes of capacity required a business model that did not exist at the time when Order 2222 was written, reducing incentives to develop mature market programs quickly.
So how does the ADER program work? For a given market participant (e.g. Base’s retail entity) one resource is formed per loadzone, and is dispatched every 5 minutes by ERCOT’s Security Constrained Economic Dispatch (SCED) process according to submitted bids to buy or sell, which is standard for all utility-scale generation plants, battery energy storage sites, and controllable loads. Each ADER resource, under current program rules, is settled according to the loadzone price.
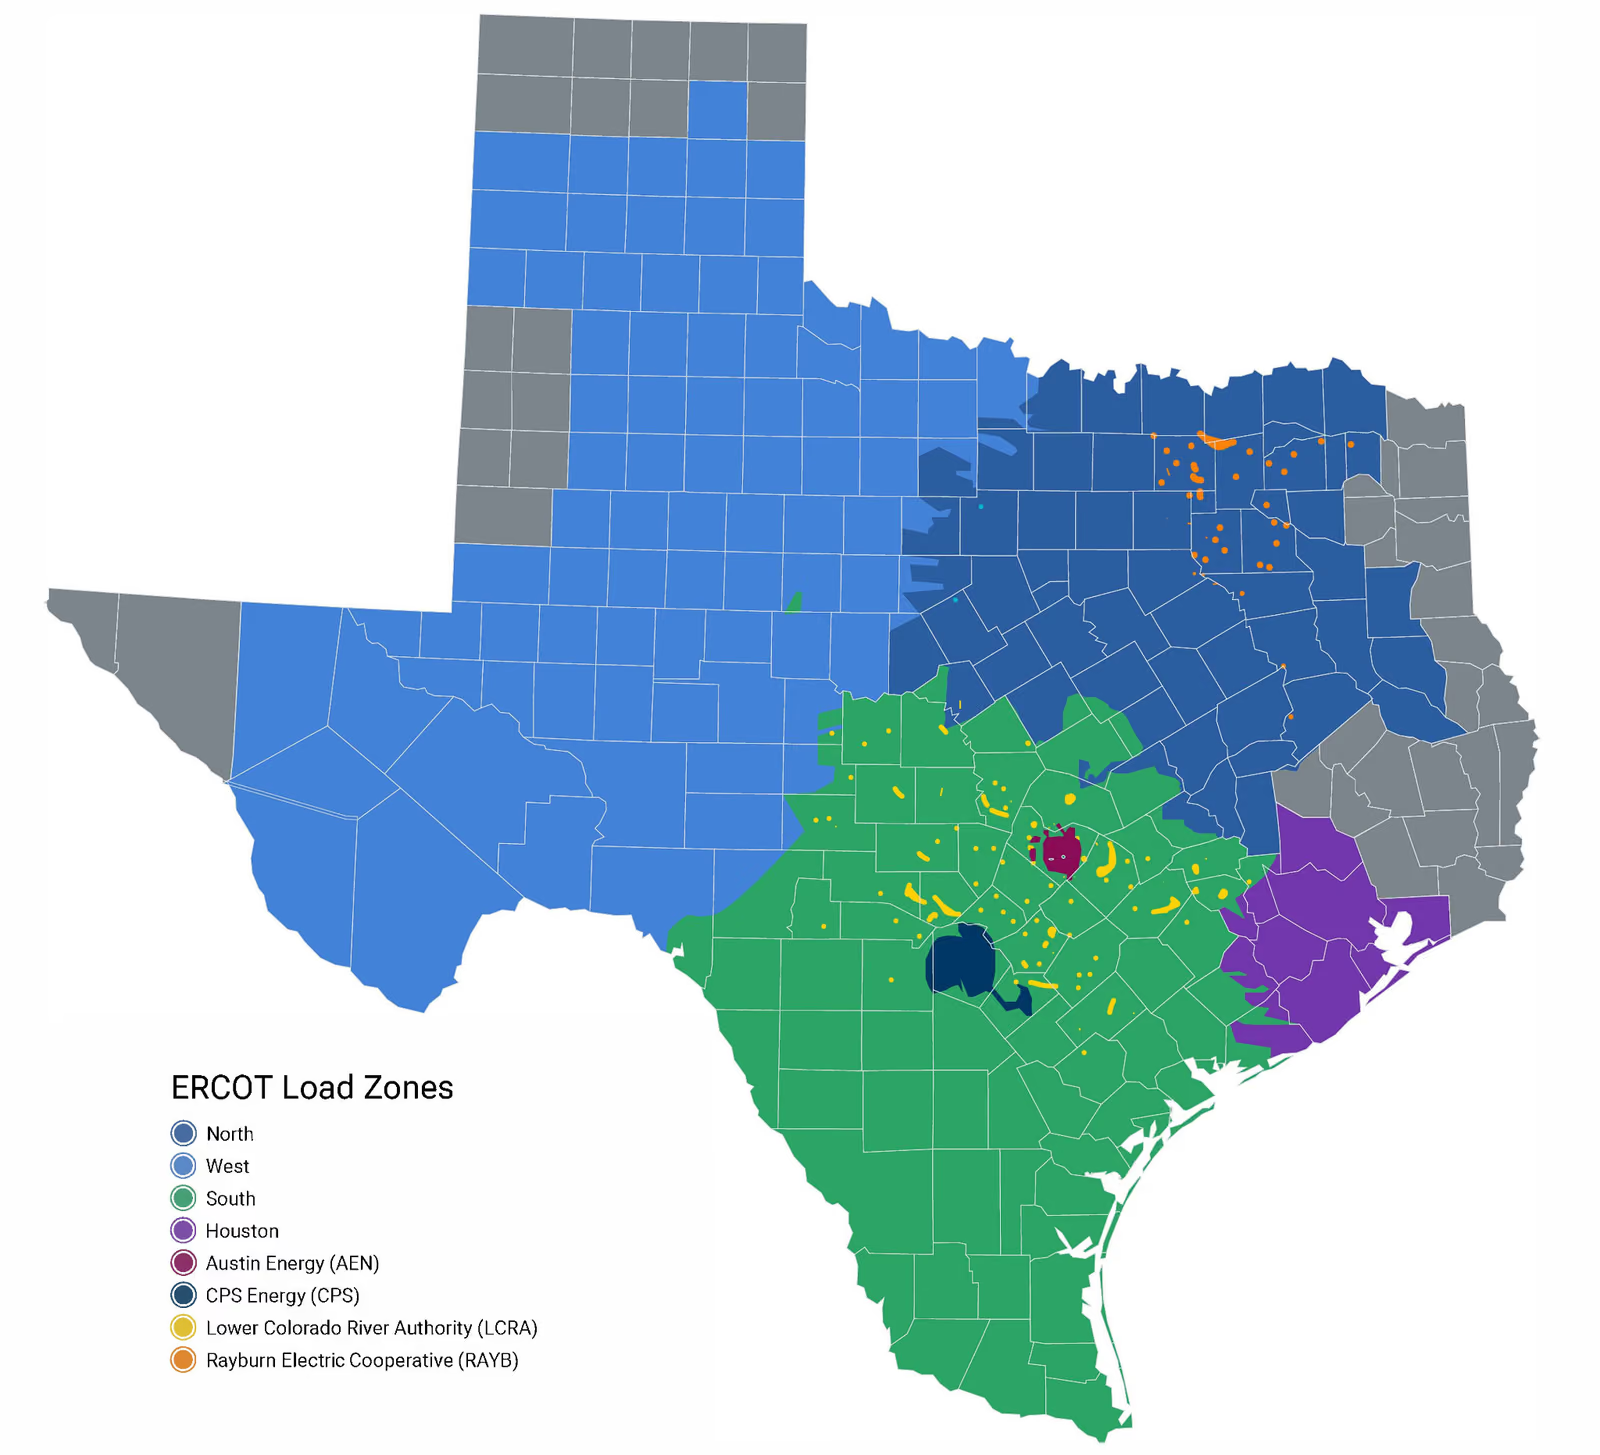
Resource formation from scratch requires 6 major steps:
- Installation: Devices are installed on a home and an interconnection agreement is approved by the host distribution utility. The meter is configured to read net exported energy in addition to imports.
- Registration: All participating devices are documented, including their individual maximum charge and discharge capacity, energy storage volume, and premise meter ID, which is then submitted to both the host distribution utility and ERCOT for review. This ensures these premises are not enrolled in incompatible programs; and for accepted devices and premises, this sizes the resource’s aggregate capability to provide energy and ancillary services.
- Interconnection: The approved volume is submitted to the final stage of ERCOT’s resource integration and ongoing operations (RIOO) interconnection pipeline, where the resource is modeled and prepared for consumption by SCED.
- Telemetry: The aggregate resource is networked to SCED via a standard SCADA protocol (ICCP) in accordance with ERCOT’s network connectivity requirements (direct and redundant connection to their Wide Area Network via a dedicated router).
- Qualification: The aggregate resource is then tested by dispatching directly through SCED, a basepoint is sent to the resource and defined tolerances are met.
- Ancillary Services: Additional deployment testing is utilized for ancillary services like reserves, in the case of ERCOT these are Non-spinning reserves and ERCOT Contingency Reserve Service (ECRS).
This process is repeated for every major tranche of new devices. In practice this cadence is governed by the release schedule for the network model utilized by SCED and limited only by the speed of device and premise registration process: today performed manually, but still only about 60 days from installation to participation in SCED. A digital registration process under evaluation by ERCOT and partner distribution utilities will further expedite.
Enabling these steps to form a functional ADER resource required addressing the major roadblocks facing Order 2222’s implementation broadly. These also naturally address our three major questions: can such a resource 1) achieve credible volume, 2) be reliably and accurately dispatched, and 3) deployed to the benefit of the transmission system?
Question 1: Achieving credible volume
Base is the largest participant in the ADER program. A year since initial qualification, Base constitutes 103 of 145 total MW registered ADER participants, or 71% of the program, participating in market 24/7, responsive to 5-minutely ramping dispatches from ERCOT, and this volume is growing rapidly. The value proposition to end Base members makes hosting a Base Core a no-brainer.
Base fleet nameplate, and the share enrolled in an ERCOT ADER
Nameplate discharge capacity by month, May 2025 – August 2026
- LZ Houston ADER, pending +30 MW
- LZ Houston ADER
- LZ South ADER
- LZ North ADER
- Rest of the Base fleet
Every series is pinned to its running maximum, because device replacement drifts measured nameplate down in a way this figure is not about. Capacity is nameplate, not the instantaneous capability ERCOT is telemetered, so the ADER segments run slightly under the MW those partitions register as available. Partner-utility fleets are excluded entirely. August 2026 is a partial month. Source: Base fleet telemetry and the ADER partition registry.
View the data as a table
| Month | Fleet | LZ North | LZ South | LZ Houston | ADER share |
|---|---|---|---|---|---|
| May 2025 | 28.9 | 0.0 | 0.0 | 0.0 | 0% |
| Jun 2025 | 34.3 | 4.2 | 2.8 | 0.0 | 20% |
| Jul 2025 | 43.2 | 4.2 | 2.8 | 0.0 | 16% |
| Aug 2025 | 51.4 | 4.2 | 2.8 | 0.0 | 14% |
| Sep 2025 | 60.5 | 4.2 | 2.8 | 2.0 | 15% |
| Oct 2025 | 73.1 | 4.2 | 2.8 | 2.0 | 12% |
| Nov 2025 | 84.1 | 4.2 | 2.8 | 2.0 | 11% |
| Dec 2025 | 89.5 | 4.2 | 2.8 | 8.9 | 18% |
| Jan 2026 | 100.1 | 14.7 | 5.2 | 8.9 | 29% |
| Feb 2026 | 115.3 | 14.7 | 5.2 | 8.9 | 25% |
| Mar 2026 | 136.3 | 14.7 | 5.2 | 24.1 | 32% |
| Apr 2026 | 155.8 | 22.9 | 7.2 | 24.1 | 35% |
| May 2026 | 172.7 | 22.9 | 7.2 | 50.5 | 47% |
| Jun 2026 | 188.6 | 22.9 | 7.2 | 50.5 | 43% |
| Jul 2026 | 205.5 | 22.9 | 7.2 | 50.5 | 39% |
| Aug 2026 | 205.5 | 22.9 | 7.2 | 50.5 | 39% |
For Base alone, we are currently energizing 2 MW per day, 20x faster than many individual utility-scale battery sites relative to their time spent in the interconnection queue; Base is already closing in on 1 GW installed per year, online that same year. A 2025 report from Woodmac estimates the distributed independent power producer industry segment accounts for 35 GW of DR nationally (inclusive of thermostat programs). Woodmac indicates an increasing share of this capacity growth will be procured by utilities directly and spread across their system in the form of dispatchable DERs.
Question 2: Dispatchability
For a balancing authority to dispatch and compensate an ADER resource, the authority needs to know how much energy the resource can supply for a given interval, and whether the resource accurately supplied it. A key question is whether to 1) utilize data as measured by the participating device and communicated by the aggregator, or 2) read from digital premise meter data after-the-fact. Device telemetry is realtime, but needs to be verified by the balancing authority and shown to be within sufficient tolerance. Meter data cannot provide realtime information to the balancing authority for dispatch and is inclusive of other site loads which cannot be easily disambiguated, but it is a trusted third-party arbiter for settlement.
Step 4 of the resource formation process instruments communication between the resource and ERCOT (detailed below) and Step 5 validates that the aggregate resource is responsive to instructions from SCED.
Base ADER fleet response to ERCOT power instructions
Partition lz-houston-ader, 21:00–00:00 Central. Positive MW is discharge.
- CLREDP tolerance — the greater of 2 MW or 15% of max capability
- ERCOT SCED base point
- Set point dispatched to fleet
- Power realized by fleet
An interval is scored only where at least 80% of its evaluation window carries both telemetry and a set point, so 36 of the period’s intervals qualify. Max discharge capability 46.9 MW gives ±7.03 MW; max charge capability 46 MW gives ±6.9 MW. Telemetry held for more than 180 seconds is treated as stale rather than as a flat dispatch and is blanked from the realized trace. Source: Base fleet telemetry and ERCOT-issued base points.
View the data as a table
| Interval (CT) | Set point | Realized | Deviation | Tolerance | Status |
|---|---|---|---|---|---|
| 21:00 | 5.0 | 3.6 | −1.3 | ±7.03 | Within |
| 21:05 | 9.6 | 8.5 | −1.1 | ±7.03 | Within |
| 21:10 | 10.5 | 10.4 | −0.1 | ±7.03 | Within |
| 21:15 | 9.7 | 9.5 | −0.2 | ±7.03 | Within |
| 21:20 | 11.1 | 10.2 | −0.8 | ±7.03 | Within |
| 21:25 | 12.0 | 11.6 | −0.4 | ±7.03 | Within |
| 21:30 | 11.7 | 11.4 | −0.2 | ±7.03 | Within |
| 21:35 | 11.7 | 11.3 | −0.4 | ±7.03 | Within |
| 21:40 | 11.6 | 11.4 | −0.2 | ±7.03 | Within |
| 21:45 | 11.5 | 11.1 | −0.4 | ±7.03 | Within |
| 21:50 | 11.6 | 11.2 | −0.4 | ±7.03 | Within |
| 21:55 | 11.7 | 11.4 | −0.3 | ±7.03 | Within |
| 22:00 | 12.1 | 11.6 | −0.4 | ±7.03 | Within |
| 22:05 | 27.7 | 22.3 | −5.5 | ±7.03 | Within |
| 22:10 | 43.3 | 40.9 | −2.4 | ±7.03 | Within |
| 22:15 | 46.7 | 45.7 | −1.0 | ±7.03 | Within |
| 22:20 | 46.7 | 45.8 | −0.9 | ±7.03 | Within |
| 22:25 | 46.7 | 45.8 | −0.9 | ±7.03 | Within |
| 22:30 | 30.5 | 34.9 | 4.4 | ±7.03 | Within |
| 22:35 | 8.0 | 11.4 | 3.4 | ±7.03 | Within |
| 22:40 | 0.0 | −0.2 | −0.2 | ±7.03 | Within |
| 22:45 | −0.1 | −0.2 | −0.2 | ±6.90 | Within |
| 22:50 | −15.9 | −10.6 | 5.3 | ±6.90 | Within |
| 22:55 | −37.9 | −32.9 | 5.0 | ±6.90 | Within |
| 23:00 | −28.1 | −32.7 | −4.6 | ±6.90 | Within |
| 23:05 | −6.5 | −9.5 | −2.9 | ±6.90 | Within |
| 23:10 | 0.0 | −0.2 | −0.2 | ±7.03 | Within |
| 23:15 | 0.0 | −0.2 | −0.2 | ±7.03 | Within |
| 23:20 | 0.0 | −0.2 | −0.2 | ±7.03 | Within |
| 23:25 | 0.0 | −0.2 | −0.2 | ±7.03 | Within |
| 23:30 | 0.0 | −0.2 | −0.2 | ±7.03 | Within |
| 23:35 | −15.7 | −10.4 | 5.3 | ±6.90 | Within |
| 23:40 | −38.1 | −33.0 | 5.1 | ±6.90 | Within |
| 23:45 | −45.8 | −44.7 | 1.1 | ±6.90 | Within |
| 23:50 | −45.7 | −44.6 | 1.1 | ±6.90 | Within |
| 23:55 | −43.9 | −43.3 | 0.6 | ±6.90 | Within |
While our aggregations in ERCOT’s ADER program utilize device-level telemetry for participation in SCED, settlement is still the responsibility of the premise meter. This short-circuits settling the resource independently, and the aggregate premise meters settle Base on the net of both premise load and DER imports and exports. To utilize device-level telemetry for settlement is at its core a verification and validation (V&V) challenge, and premise AMI are known quantities, with validated tolerances, and verified performance.
Base continues to advocate for the use of revenue-grade meters on the device for both realtime telemetry and settlement. These certifiably meet identical ANSI C12.1-2026 standards, but audit requirements are necessary to maintain cemented trust between the balancing authority and an ADER operator. Precedence for this exists in many ISOs; other comparable grid-scale resources install and maintain their own metering subject to the same audit and V&V requirements (MISO BPM-005, §2.10 and §2.10.3; NYISO Market Administration and Control Area Services Tariff §13).
Most importantly, all of this data exchange is supported by a best-in-class solution to meet NERC and ERCOT telecommunications standards and requirements applied to any other bulk capacity operated on the grid today. Importantly these include:
- Physical access control to operations centers and protected edge device internals
- Private backhaul to isolated SOC2 compliant cloud operations
- Encrypted edge protocols
- Isolated edge devices (somehow gaining access to an edge device provides no additional visibility or privileged access to the wider network)
- Highly limited user access, consistent with laws like the Lonestar Infrastructure Protection Act
Base ADER connectivity for SCED operations
How the fleet, Base's operations and ERCOT's systems are connected as a qualified market participant.
- Base
- ERCOT
- Control flows
- Communication flows
The networking solution approaches the closest in spirit to both NERC and ERCOT requirements: physical access control to operations centers, private backhaul to isolated SOC2-compliant cloud operations, encrypted edge protocols, isolated edge devices, and highly limited user access.
Question 3: Transmission value
The ADER resource category is at a critical juncture in ERCOT, and for ISOs across North America facing similar load growth challenges. ERCOT has implemented the Batch Study Process for large load (>75MW) interconnection, largely composed of new data center construction. Firm headroom is to be allocated collectively across sites on the basis of total network impacts realized by loadflow studies under a variety of pre-defined operating conditions. Generation which could address firm headroom-limiting constraints would necessarily be modeled according to the transmission POI to which they are connected.
This is a key value that ADER resources can provide: a rapidly installable source of targeted capacity that can be directly procured by loads seeking expedited interconnection at risk of headroom limitations or curtailment. Moreover, these large load-enabling aggregations can be deployed to the direct benefit of the end rate payers sharing the same grid.
Hence ERCOT has shared a draft of a new Phase IV to the ADER pilot, which aims to model aggregate distributed energy storage resources as a nodally recognized resource according to the transmission system POI that the constituent devices are installed downstream of.
Impact of Base aggregations on ERCOT transmission substation power flows
Net injection at two 138 kV buses on 16 January 2026, against ERCOT's 60-day state estimator disclosures. Negative injection means the substation is serving load.
- State estimator net injection, 16 Jan
- Baseline, mean of 15 and 17 Jan
- Battery fleet power
- Discharge block
- Charge block
Load on 16 January ran lighter than the flanking days all day, so the level gap between the two traces is mostly load, not battery; the signal is the change in that gap across blocks. “Flow change per MW cycled” compares hour over hour with the baseline’s own hour-over-hour change removed. Every one of the ten transitions moves in the direction the fleet moved, but the measured swing runs larger than the metered fleet power — unexplained here, and worth resolving before the ratio is quoted as a result. Source: ERCOT 60-Day State Estimator line-flow disclosures (NP6-619) and Base fleet telemetry.
View the data as a table
| Hour (CT) | Bus A measured | Bus A baseline | Bus A fleet | Bus B measured | Bus B baseline | Bus B fleet |
|---|---|---|---|---|---|---|
| 01:00 | −15.8 | −17.8 | −0.0 | −12.7 | −14.2 | −0.0 |
| 02:00 | −15.4 | −18.0 | 2.0 | −12.1 | −14.6 | 1.5 |
| 03:00 | −11.8 | −18.0 | −0.5 | −10.9 | −15.8 | −1.0 |
| 04:00 | −16.3 | −19.4 | 2.1 | −14.6 | −16.2 | 1.5 |
| 05:00 | −13.0 | −20.8 | −2.1 | −12.7 | −17.7 | −1.6 |
| 06:00 | −21.9 | −22.9 | −0.0 | −18.8 | −19.5 | −0.0 |
| 07:00 | −19.2 | −24.2 | 0.1 | −19.9 | −22.9 | −0.0 |
| 08:00 | −18.6 | −24.8 | −0.3 | −18.4 | −23.4 | −0.0 |
| 09:00 | −15.9 | −23.6 | −0.3 | −17.9 | −22.7 | −0.0 |
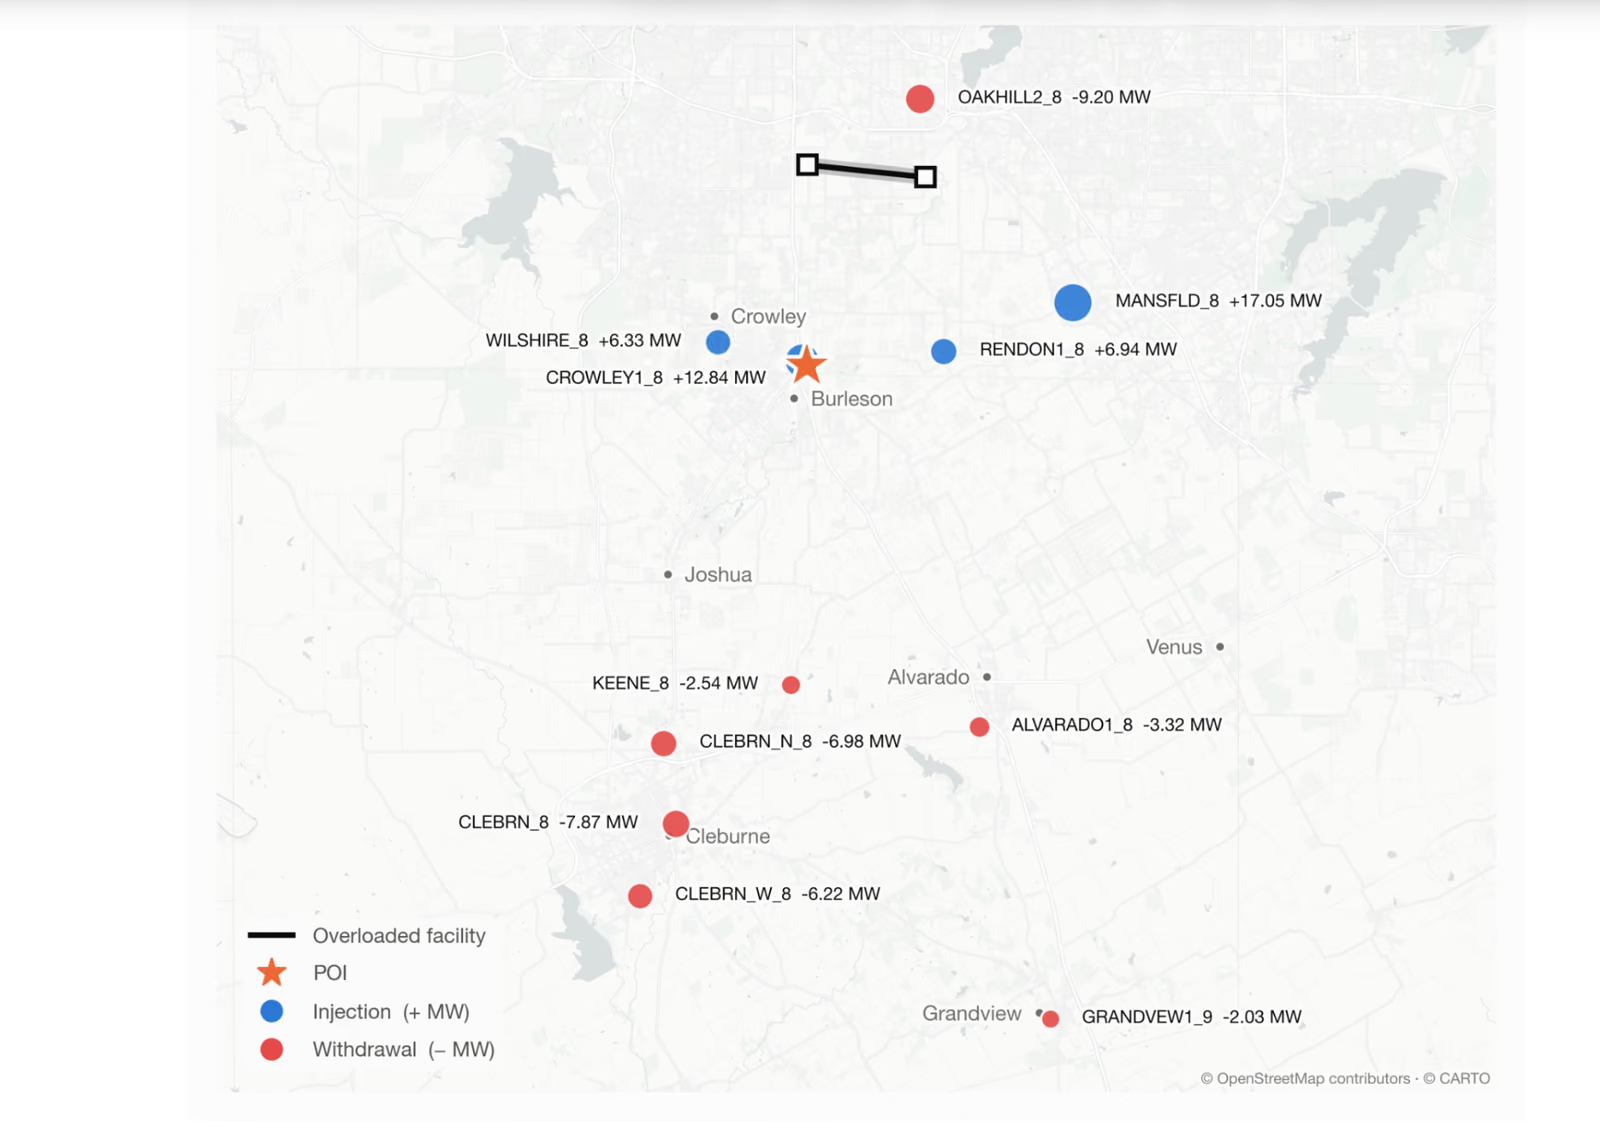
Our partners at Piq Energy have conducted an independent study of this exact case for a number of prospective new large load sites in ERCOT. A prospective 100 MW load aiming to connect to the Burleson Switch appears to create new constraint violations under currently approved interconnection load flow study scenarios. Piq’s loadflow analysis confirms that the addition of approximately 80 MW of aggregate batteries at target substations fully alleviates these constraints under all contingencies evaluated by ERCOT.
This Piq study evaluates a number of other new large load scenarios, showing that in many cases a plurality of realized constraint violations can be fully or partially alleviated with targeted deployments of residential batteries operated as ADER Phase IV-compliant nodal aggregations. Moreover, these deployments are frequently smaller in total MW of nameplate capacity relative to the size of the large load seeking interconnection. The details of their study can be found here.
Constraint relieving aggregation siting
With orders of magnitude more bulk system load substations to choose from, DER's can capitalize on strategic siting to clear binding constraints. The pair below shows the same import pocket with and without storage sited behind the monitored element.
Two 20 MW aggregations, sited behind the binding element
A 500 MW data center overloads its import path after a contingency. The same relief is reached with 40 MW sited in the pocket, or roughly 490 MW spread across the load zone.
With the parallel circuit out of service, everything the pocket draws lands on 5127__A. The data center alone contributes 450 MW of that flow, putting the element 32 MW over its emergency rating.
Relief is the linearised product of the reliever bus’s power transfer distribution factor on the monitored element and the MW discharged there. Magnitudes are quoted as |PTDF| with the direction stated in words — a 500 MW draw adds flow, a 20 MW discharge removes it — so load-sign and injection-sign conventions are never mixed in one figure. These |PTDF| values are higher than a meshed area would score because this topology puts the relievers inside a radial import pocket. Substation, line and contingency names are invented and the numbers are illustrative; nothing here is a real ERCOT element or a real Base deployment.
View the data as a table
| Quantity | Value |
|---|---|
| 5127__A emergency rating | 1,200 MVA |
| Post-contingency flow, data center at load | 1,232 MW |
| Excess over rating | +32 MW |
| Data center shift factor on 5127__A | 0.90, so +450 MW of that flow |
| WILLOW BEND |PTDF| | 0.88 — −17.6 MW per 20 MW discharged |
| PECAN FLAT |PTDF| | 0.83 — −16.6 MW per 20 MW discharged |
| Total relief, 40 MW sited in the pocket | −34.2 MW |
| Resulting flow | 1,198 MW, within the rating |
| Load-zone average |PTDF| | 0.07 — 2.8 MW from the same 40 MW |
| Unsited capacity for the same relief | ≈490 MW |
Conclusion
The first half of the 20th century saw explosive growth in the electric power grid in North America, creating some of the largest synchronous machines on the planet. Now electrical growth is on a renewed rise. Enormous new productive load is being connected to the grid and new generation, transmission, and storage capacity is needed to make, move, store, and ultimately sell energy to people at an affordable price.
ERCOT is leading with the ADER program, and introduction of Phase IV is creating a powerful new tool to help meet these needs, and ultimately benefit end rate payers in Texas with improved affordability and reliability while still meeting the electrical demands of the 21st century.